Analysing deadlocks with Java Virtual Machine Diagnostics
Dead lock detection using JVMD
The aim of this manual is to show how useful is the Java Virtual Machine Diagnostics to find the root cause of a thread deadlock in Java.
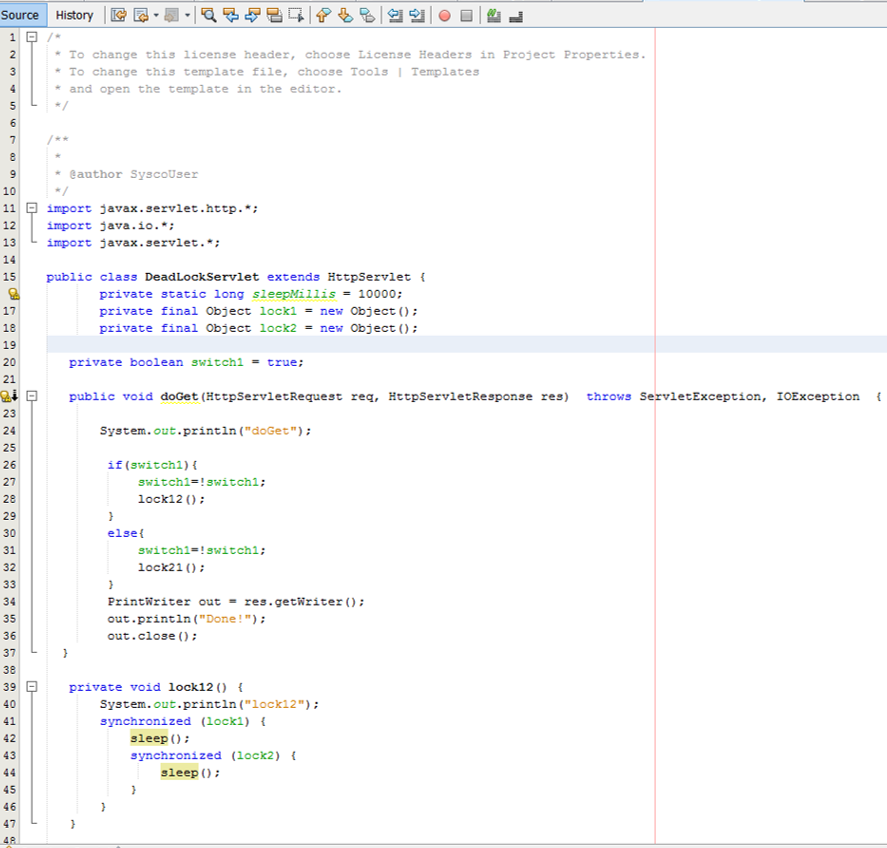
First of all, it is necessary to create a generator of deadlocks. In this case I’ve made a little web application whose goal is to generate thread deadlocks. The code of this application was downloaded from [1]. The program is very simple as you can see:
Dead lock generator called WebDeadLockV2.0
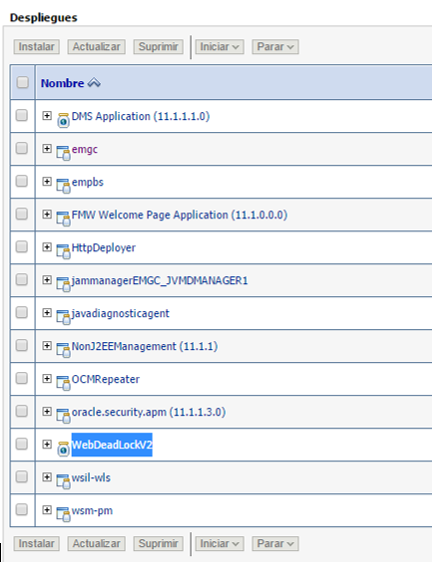
The thread deadlocks generators is deployed on a Weblogic server. In this case, I am using the Oracle Management Server (OMS) in order to save resources. However, it could be deployed in any other server under the supervision of Oracle Cloud Control.
After deploying the application I sent several requests using this URL:
https://testmachine.sysco.no:7301/WebDeadLockV2.0/deadlock
In order to get an overview of the locks you have to follow these steps:
-
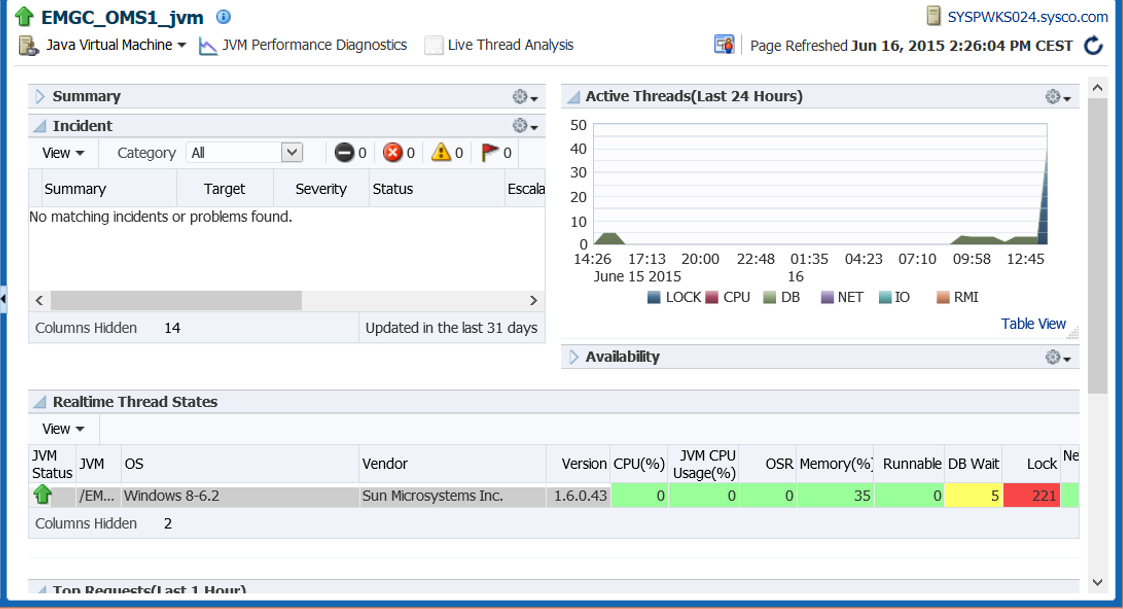
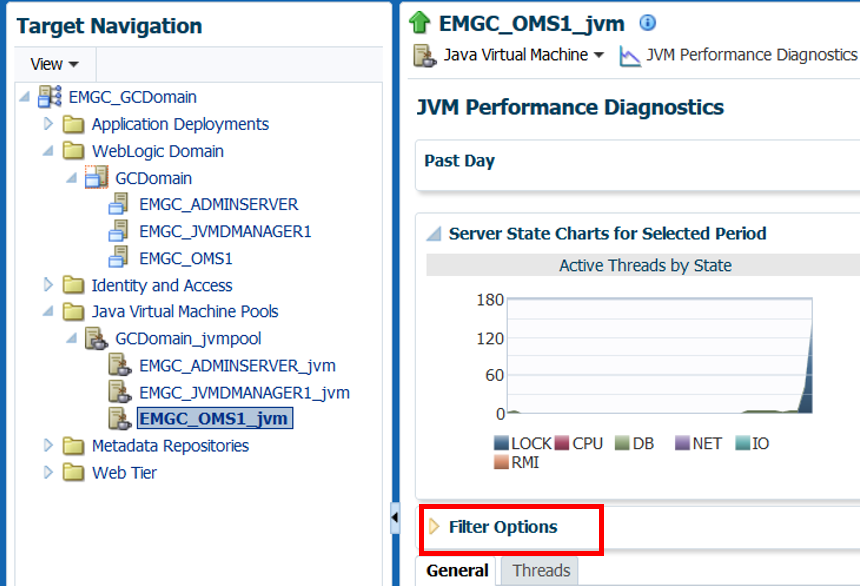
On the left panel you have to select the Java Virtual Machine Pool related to OMS

-
As a result you will see the details about this pool on the right side. The quantity of locks is remarked in red. In this case we can 221 locks.
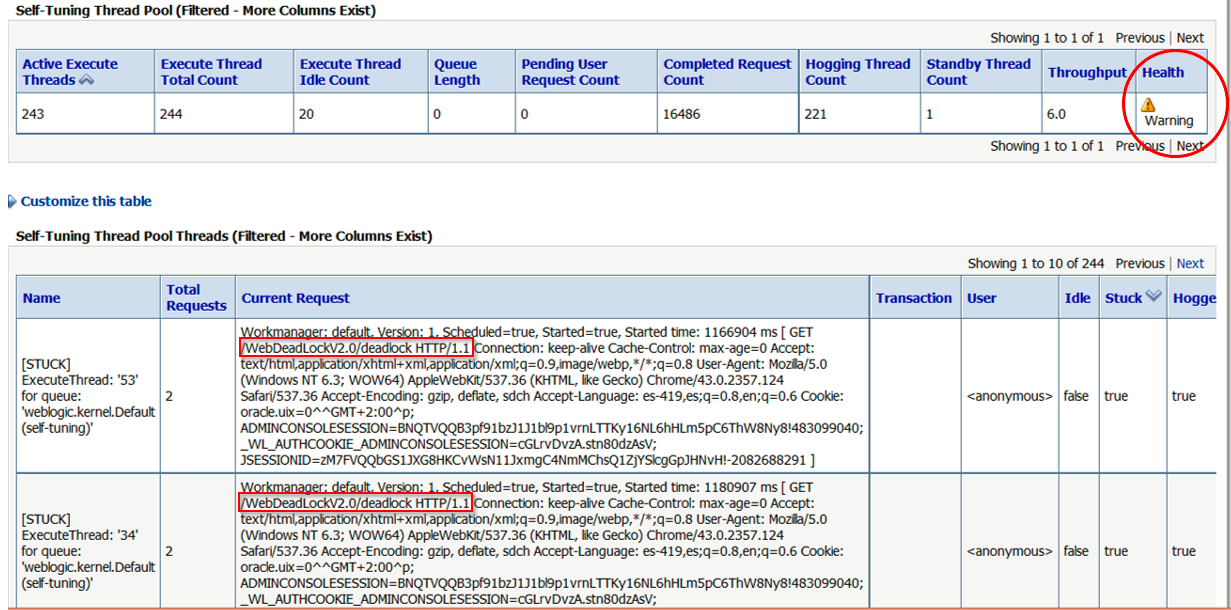
In addition, this problem also is detected by the Admin Console
What about complex scenarios?
Even though we can detect this problem using the Admin Console and the log files, the recognition of the root cause is a long way that requires matching logs and even thread dumps. This can be done easily using JVMD following these steps based on [2].
-
You have to click JVM Performance Diagnostics

-
Expand Filter Options
-
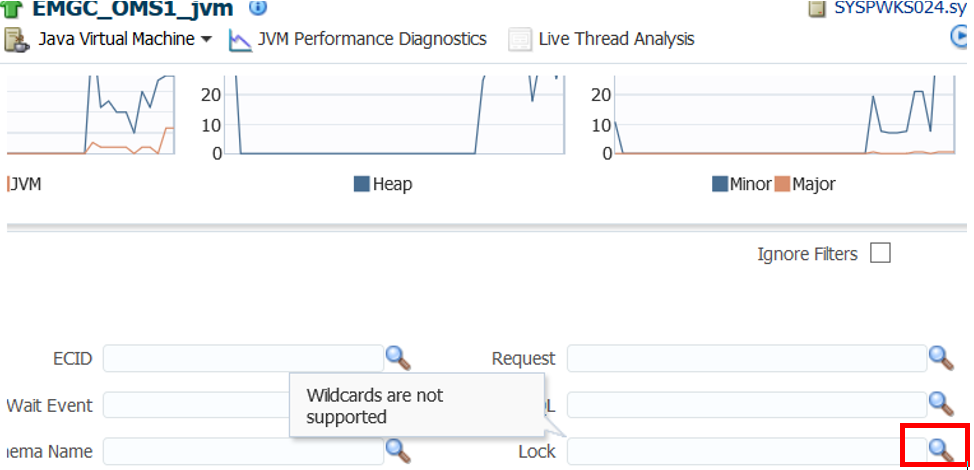
Click on Search for locks
-
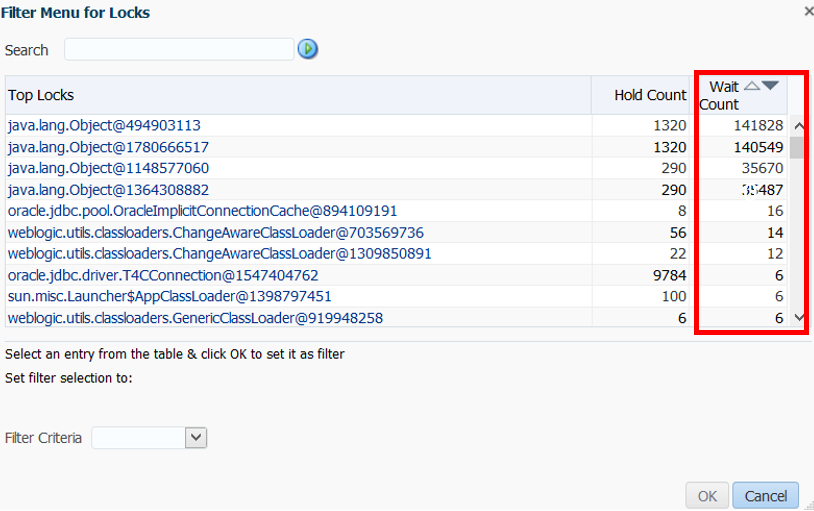
We will get a screen and then we have to order by column Wait Count.
-
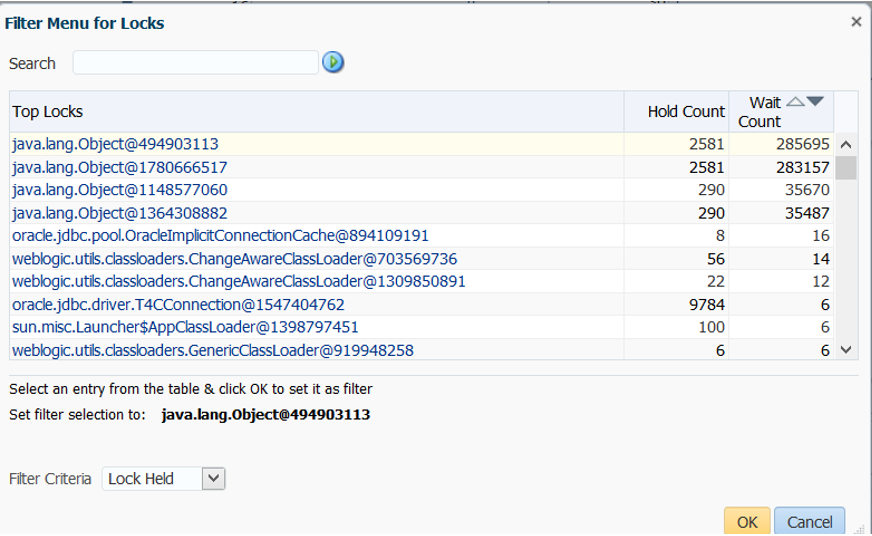
After sorting the table I selected the first one as an example. The filter Criteria is set in Lock Held and then click on OK

-
After executing the filter, we can get useful information such as:
Active threads per state
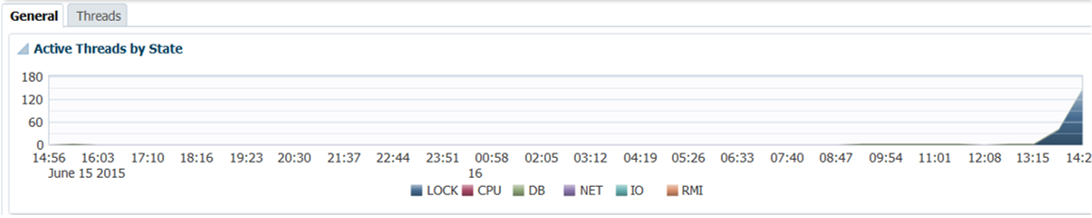
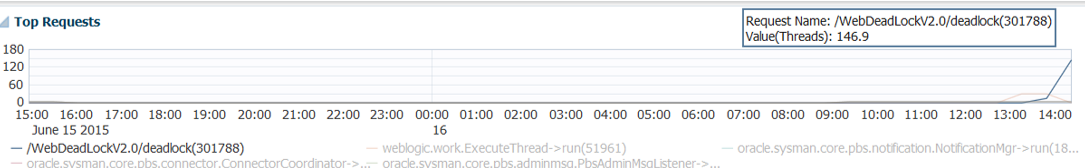
Top requests
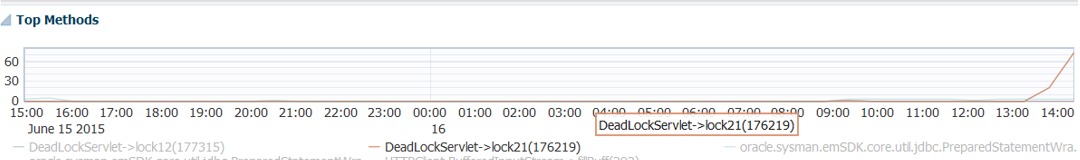
Top methods
-
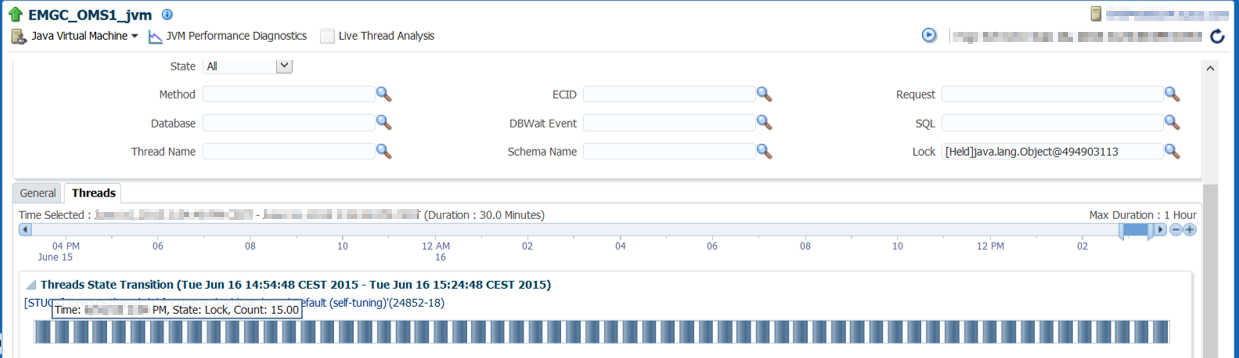
Now we can use the thread tab to get some details about threads involved in the problem
-
You have to click any of the previous blue bars to get useful information about the root cause
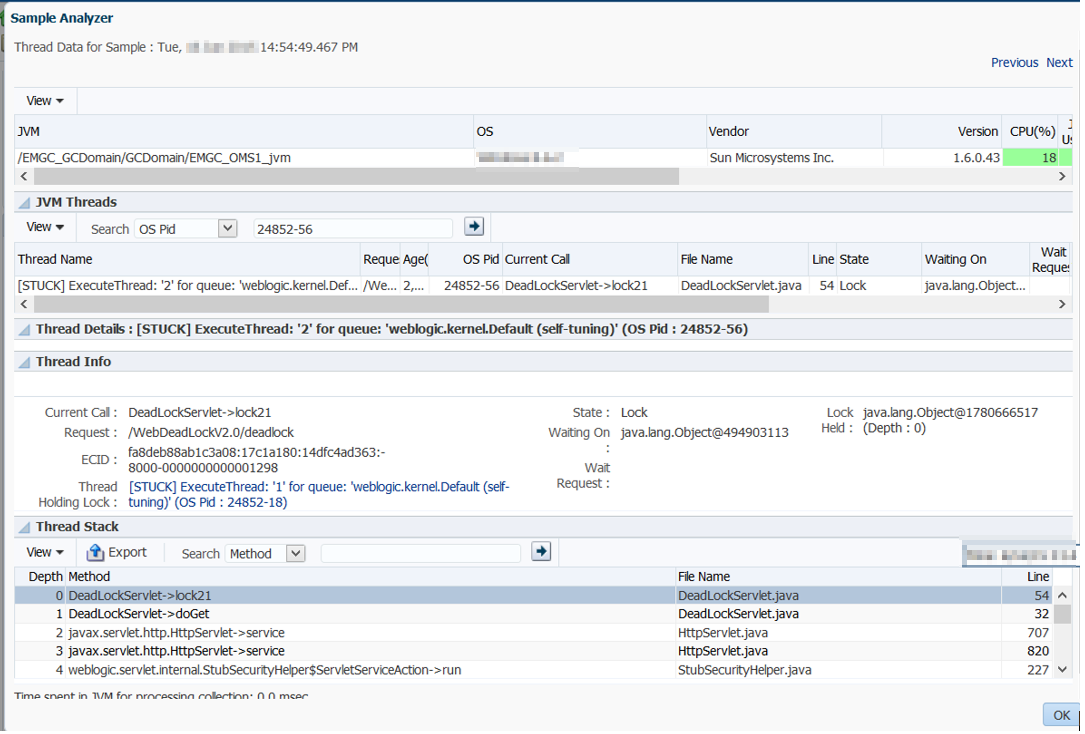
Current call: DeadLockServlet->lock21. Thus, we have a method that causes the problem with some clicks
Request: /WebDeadLockV2.0/deadlock
Thread holding the lock: [STUCK] ExecuteThread: ‘2’ for queue: ‘weblogic.kernel.Default (self-tuning)’ (PID Operating System : 3376-56)
Now you can get into: [STUCK] ExecuteThread: ‘1’ for queue: ‘weblogic.kernel.Default (self-tuning)’ (OS Pid : 24852-18)
In the previous screen we can identify:
The object for which the program is waiting for: java.lang.Object@1780666517
The depth: In this case is 0
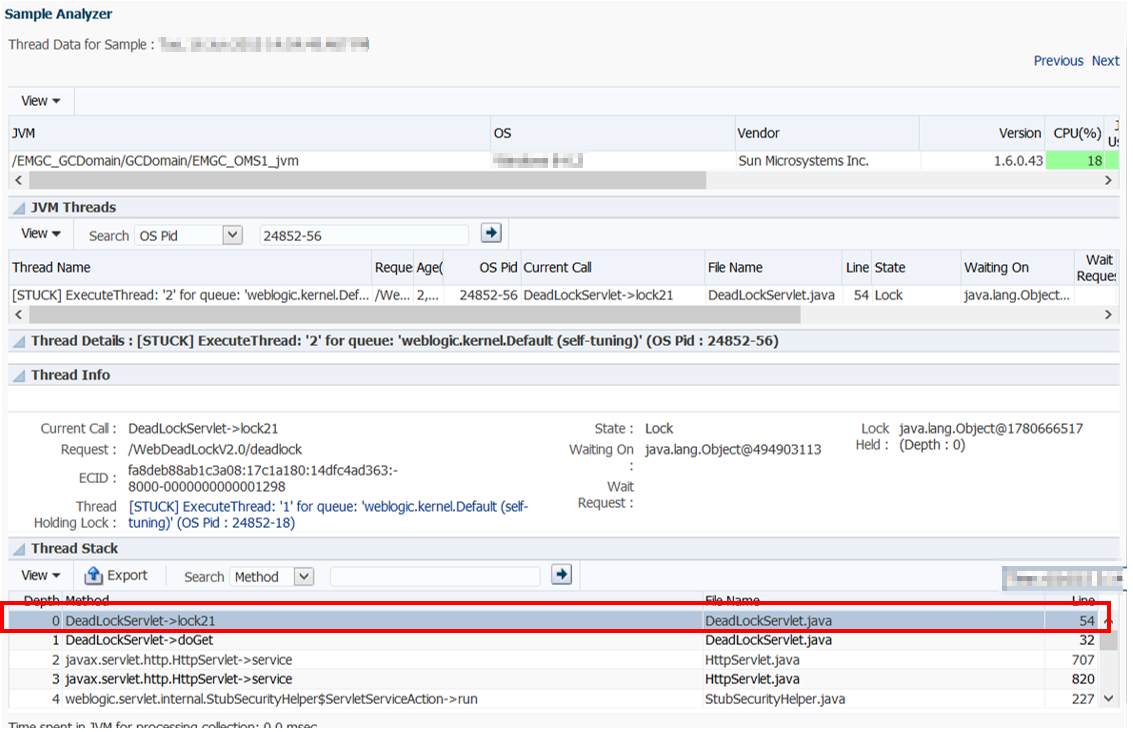
With the depth we can review the below part of the above screen (stuck thread) to get more details about the class that generates the problem
In conclusion, thanks to JVMD we can identify the problem is caused by the method lock21 that is located in the file DeadLockServlet.java in the line 54 of the source code.
References list:
[1] Ways to create a deadlock in servlet [Online document] Available from: http://stackoverflow.com/questions/11583644/ways-to-create-a-deadlock-in-servlet (Accessed: 26 June 16, 2015)
[2] https://www.youtube.com/watch?v=FNaodGLcjOM&feature=youtu.be