WebLogic JVM Setup Problems and how to address them
Introduction
When configuring server startup parameters a lot of thing have to be taken in consideration: memory and processor availability within physical or virtual machine, perceived need for resources by software running on application server, type of software running, level of network usage, etc. In that context we will examine some common configuration problems and how to address them like: choosing proper garbage collector and PermGen Java bucket misconfiguration for Java versions prior Java 8 [1].
JVM setup problems
In the first section of this article we will address various JVM command line options and how to set them up properly. We will see how these options are effecting the behavior of the WebLogic platform tremendously. Neglecting some of them might lead to undesired behavior that might severely affect our production environment that can lead to server crash situation.
Loosing the race and long memory cleanup cycles
Many administrators do not realize the fact that HotSpot JVM prior to Java 8 has three memory buckets that we have to address when sizing the memory [2]:
- Young Generation,
- Old Generation and
- Permanent Generation. (replaced with Metaspace in Java 8 [3])
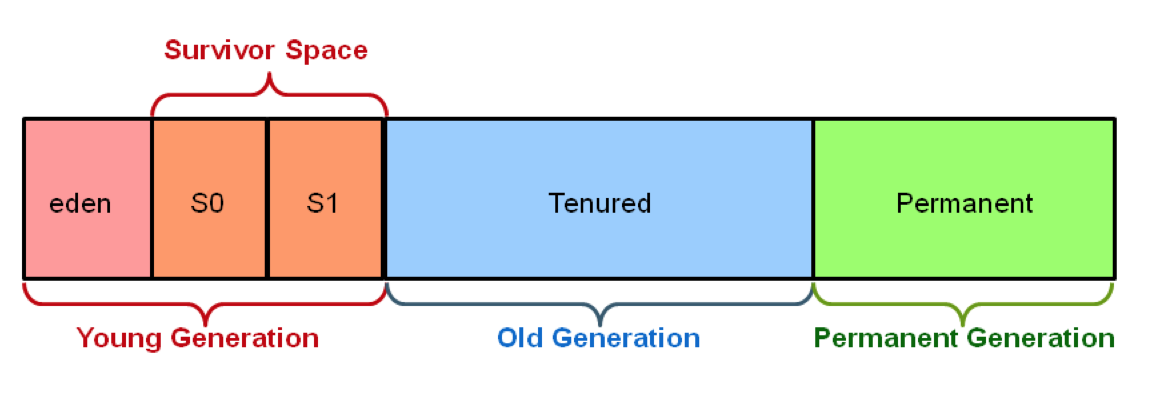
Fig. 1. HotSpot Heap memory architecture
As can be seen from Figure 1. the “Young generation” is further subdivided in:
- Eden,
- Survivor space 0 and
- Survivor space 1
The official recommendation for “Young Generation” is to occupy 30% of the total heap space with the young generation further subdivided into 20% for survivor spaces and 80% for eden. However this reciprocity might be good for small to medium memory pools but not for large ones. Before going in further discusion on this topic let us first exemine command line parameters that we can use to set memory size limits:
- -Xmx
: maximum size of Java heap space (young generation + old generation) - -Xms
: minimum size of Java heap space (young generation + old generation) - -XX:NewSize=
: Initial size of young generation space - -XX:MaxNewSize=
: Maximum size of young generation space - -XX:NewSize=
: Initial size of young generation space - -XX:MaxNewSize=
: Maximum size of young generation space - -XX:NewRatio=
: Ratio of young generation space to tenured space - -XX:PermSize=
: Initial size of permanent generation space - -XX:MaxPermSize=
: Maximum size of permanent generation space - -XX:MaxMetaspaceSize=
: Maximum metaspace size (Java 8)
First what we need to mention about this parameters is that both minimum and maximum sizes for whole: heap, permanent generation and young generation (if set) has to be set to the same value. Reason for that is that allocating additional space from the operating system is costly, so for any middleware implementation that should be avoided. Second thing we have to take in consideration when doing middleware implementation is that we should allocate enough ram for our application but not to over-allocate. There er two reasons for that:
- Allocating huge memory pool might create long garbage collecting cycles that can slow down performance of our application or in some cases stop our application all together while the memory has been cleaned.
- Not leaving enough memory space for other applications running on the same operating system might cause extensive swapping and thus downgrading performance of our application even more.
Overall Heap sizing
How much of the memory is enough memory? This cannot be easily known in advance so when we are sizing hardware ram requirements we have to take in consideration previous experiences with similar implementation to one that we have. However wen it comes to software imposed limits the best way to set overall heap size is by observation. Upon installing all necessary software on the middleware platform we will set initial memory values to as much as we can, taking in consideration other processes running on the same operating system to avoid unnecessary swapping. Then we will use load-testing tool (e.g. JMeter or Grinder) to simulate real load on the system. When the simulation runs we can use our favorite tool (e.g. JConsole, JVisual VM, JMission Control, etc.) to monitor memory occupancy.
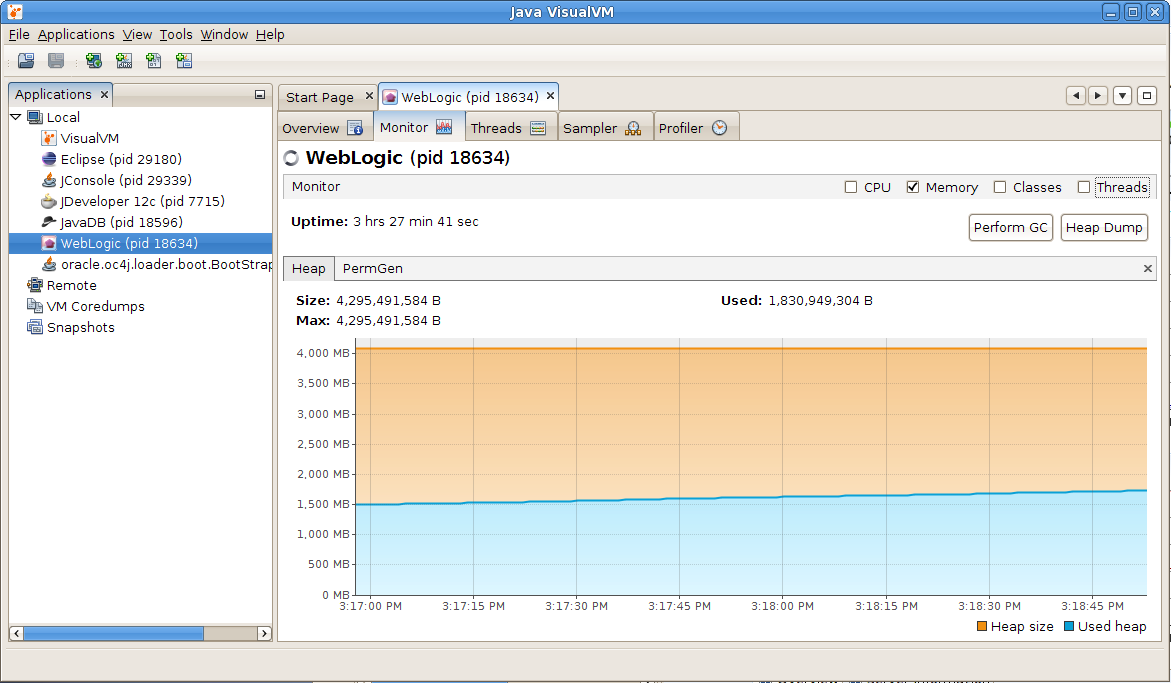
Fig. 2. Observing heap memory occupancy
With this technique we can see how much of the memory is really used when all of the programs have been loaded in memory, all of the planned users have been connected to the system and all of the application functionality has been used. As can bee seen from the observation done in Figure 2. from allocated 4 GB of RAM, only about 2,3 GB is really used. Adding safety margin of 10-15% to this amount will give us our memory allocation size.
Young generation memory sizing
As we have started to discus ratio between the young generation and old generation we have seen that we have Java command line parameters that allow us to set memory parameters for young generation expressed both as absolute memory size value or as a ratio. Although in most of the situation we do not have to set this and we can rely on Java ergonomics feature to set this ratio properly, in some cases we have to play with this parameters. What we need to keep in mind is that cleanup of young generation space is always stop the world session. That means that our program will temporarily block until the memory is cleaned. We do not want to sense these blockages, so this cleanup has to be executed as fast as possible. This can be achieved by keeping memory size of young generation to relatively small values so that this type of collection will execute more often and very fast. On the other hand we do not want to go to another extreme and size young generation space too small as in this case a lot of medium size, short living objects might get promoted to old generation space unnecessarily. So what is the ideal ratio? That largely depends on the amount of memory you are assigning as the total heap size. Larger the heap, more memory we will assign to old generation space. Again the best estimate can be achieved with observation and little human intervention.
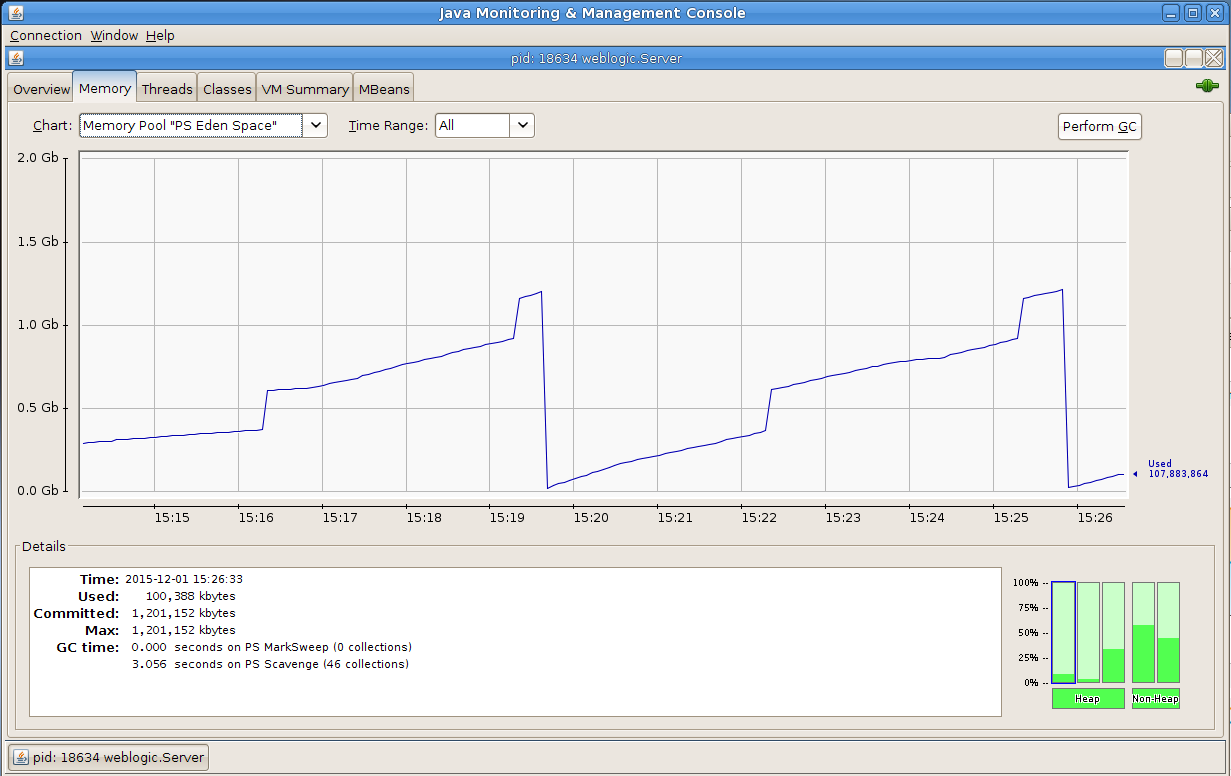
Fig. 3. Young generation memory cleanup cycles
Two factors are critical when sizing young generation space and choosing which garbage collector to use: responsiveness and throughput. Very often this two requirement are mutually exclusive. As when sizing total heap size, we will run load tests with tools like: JMeter or Grinder. However this time the application user of the most critical application will be present as well. Real application user will test responsiveness of the critical application. He will access the system in the normal way trough web interface. Now we will start our favorite monitoring tool that will allow us to observe cleanups of young generation space graphically. We newer want that our young generation space is more than 30% of overall heap space, so we can start from this value. If our heap is very large we can start from the opposite direction and set young generation space to 10%. According to the Oracle documentation the young generation size is ¼ of the overall heap size [4]. In ether way we are now going to increase or decrease the young generation value trying to find balance between frequency of the collections and perceived responsiveness of the application. We do not wont that garbage collector thread cleans up the memory to often and we do not want that our application user feel that application is lagging responsiveness or is stopping occasionally. For the pure B2B type environment without human interactivity the most critical factor is throughput so for that types of system estimate is done in slightly different way. This time we are not rely on subjective experience from the user but on the overall throughput data. In the ESB or SOA environment we can rely on the data provided by Enterprise Manager console to estimate our young generation size.
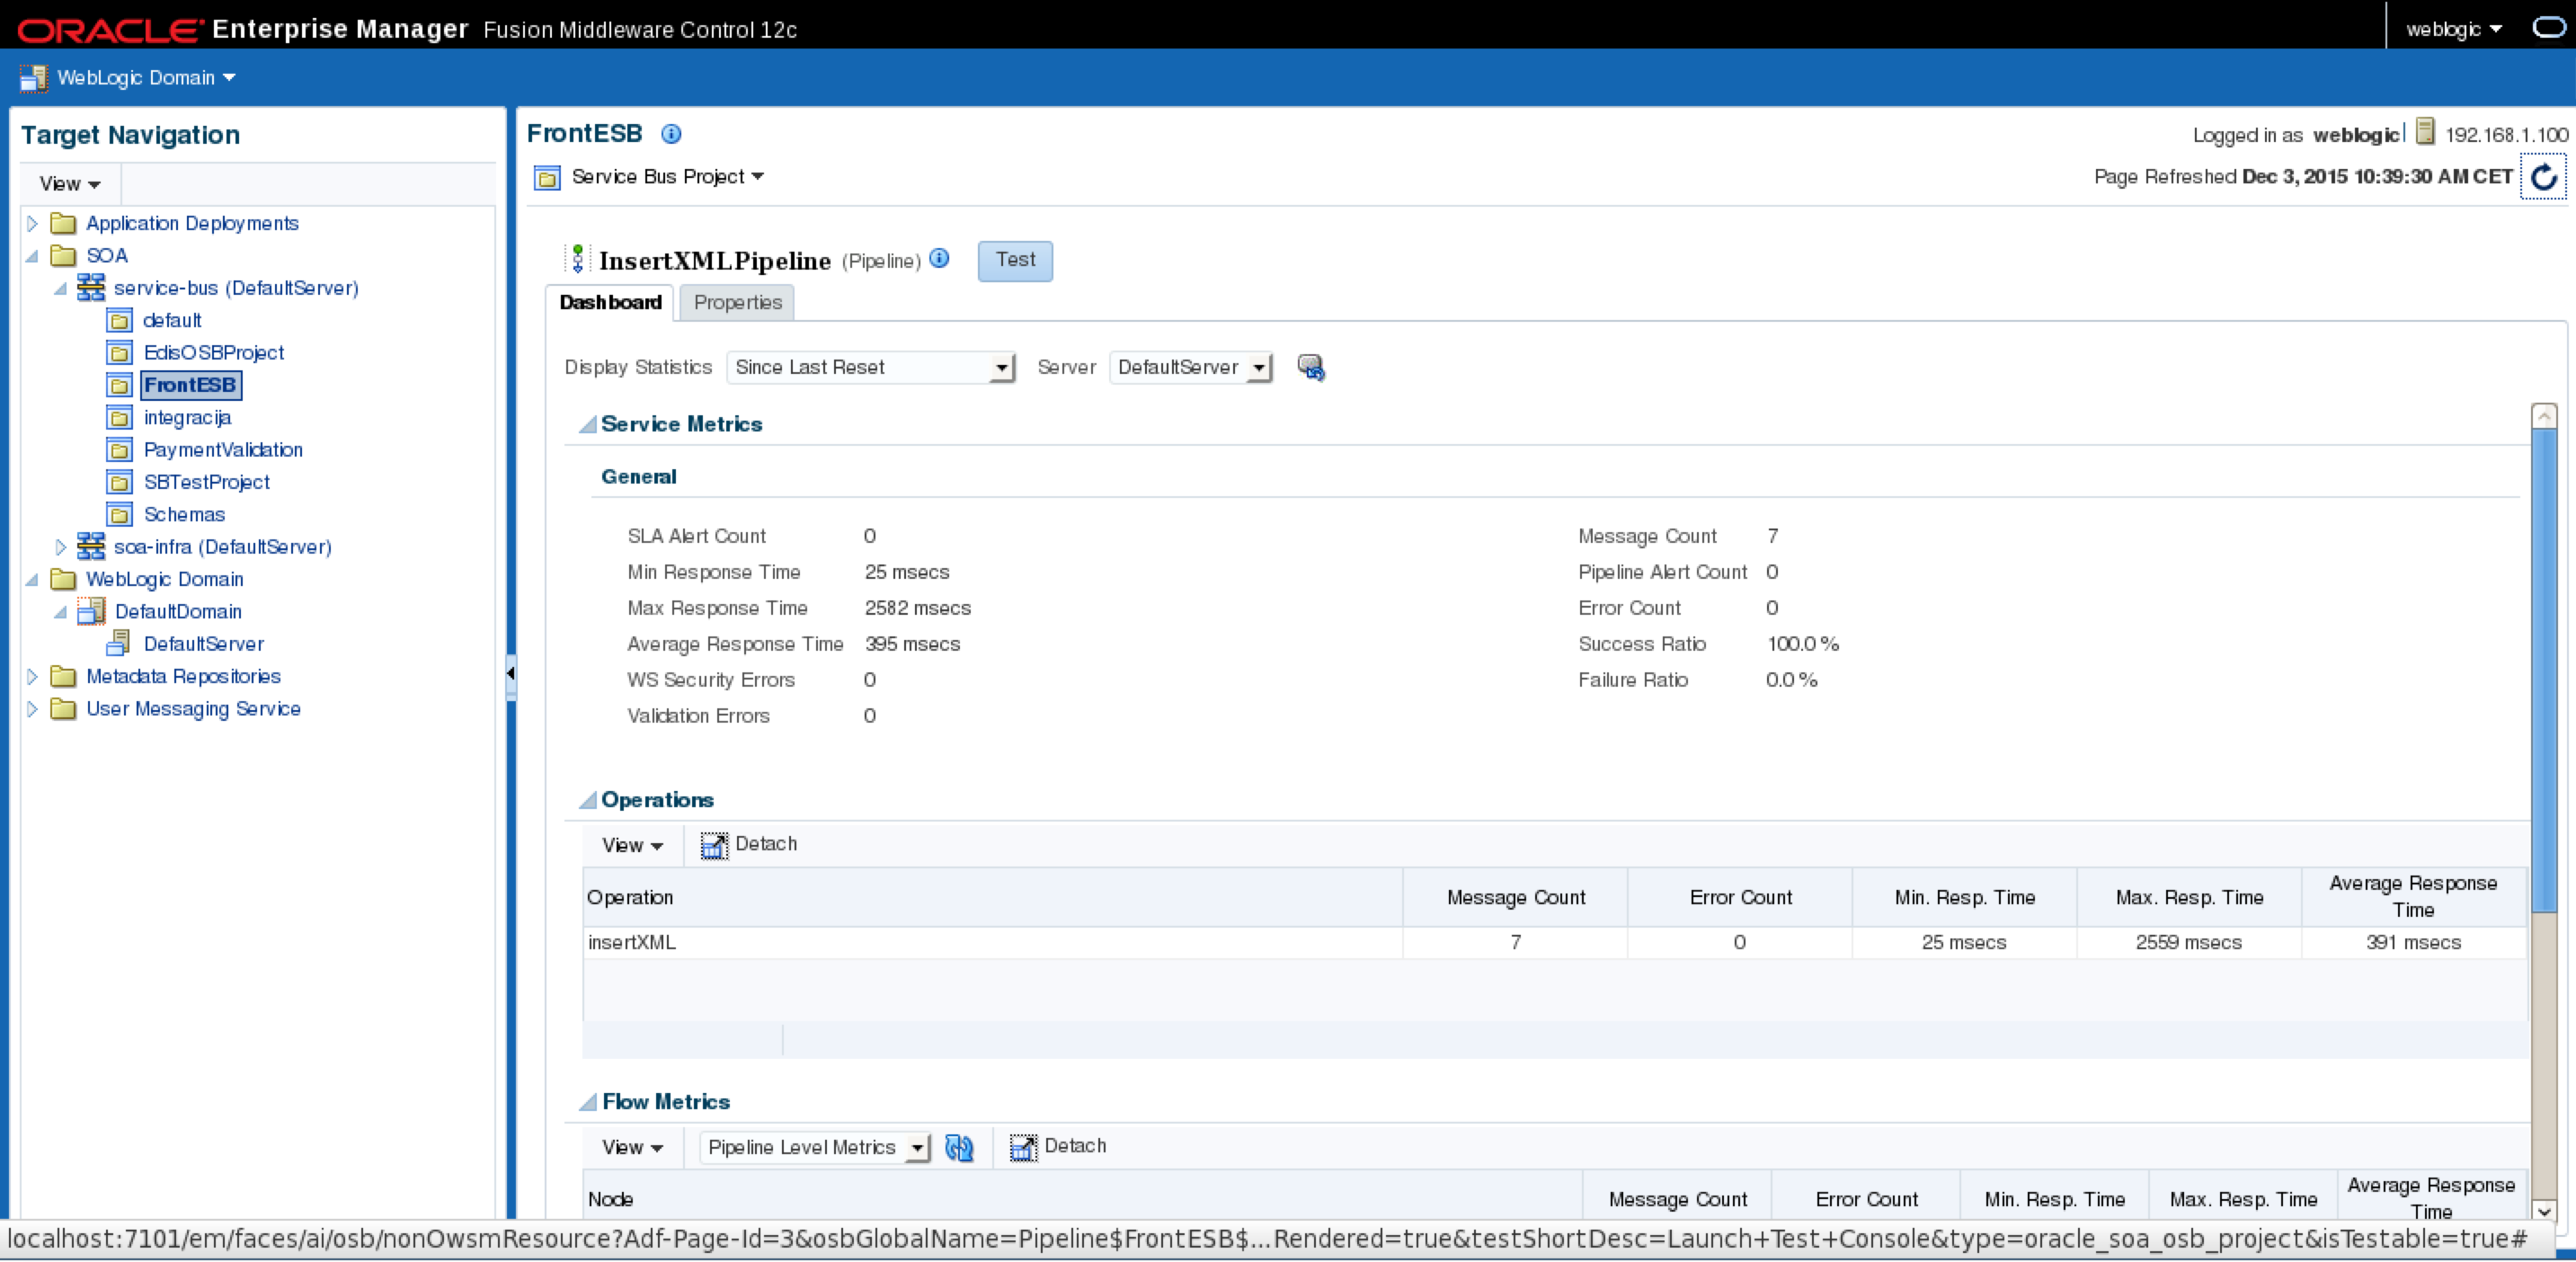
Fig. 4. Enterprise manager console collected statistics
Maximum size of new generation need not to exceed 30% of total heap size, minimum size not too small to have to frequent collections. If we see that the frequency of young generation cleanups is too fast and in the same time the old generation bucket is filled up too fast this can indicate that our young generation bucket size is above lover limit. Once when we have set up boundaries we can play with within them and observe statistics gathered from Enterprise manager. Observing the number of messages processed in the fixed amount of time (e.g. 10 mins.) can give us good estimate. Bigger the amount of messages processed, better the result. For better results it is recommended to develop a test SOA web service that does not interacts with other services and thus does not depends on their availability and responsiveness. Best result in the number of messages processed will give us our memory size.
PermGen misconfiguration and the WebLogic behavior
Permanent generation space is the space that is very often neglected and not well understood by WebLogic server administrators. Permanent generation space contains mainly the Java static variables and methods, and shared strings. When the permanent generation space is overflown the WebLogic server does not crashes immediately. As the Java virtual machine is trying to recover PermGen space, the WebLogic server will start to pour out strange Exception messages that can very often lead us to wrong conclusion. Why this strange behavior? Mainly because of the content of permanent generation space. Once that Java static has been loaded into memory it wan’t be unloaded. Basically, only shared strings are unloaded from PerGen space and that means that the quantity of released RAM after full garbage collection cycle, will be small. When the PermGen is overflown there will be problem with pointers pointing from main Heap space to permanent generation space. Pointers are going to point to wrong locations and that is why we have this strange behavior manifested as a set of strange exceptions in WebLogic server log. Depending on the system this behavior can endure from couple of seconds to couple of minutes before the server crashes. Especially if the amount of free Heap space is significant, compared to the released space in PermGen after full gc has been performed.
So how to size permanent generation space correctly? When doing that we need to have in mind several important factors:
- Permanent generation space is always added to the total space allocated to Heap. That means when planning memory allocation we have to plan: Heap space + Permanent generation space = total memory occupancy that should be less than Available RAM subtracted by Operating system requirements and memory requirements for other processes running on the same system
- As the quantity of ram released from the Permanent generation space, after full GC is relatively small (thats why the name: “Permanent”) we have to plan enough ram to accomodate all object stored in it for the whole duration of the application lifecycle.
Again, as with sizing overall Heap and Young generation sizes, best results will be achieved by monitoring.
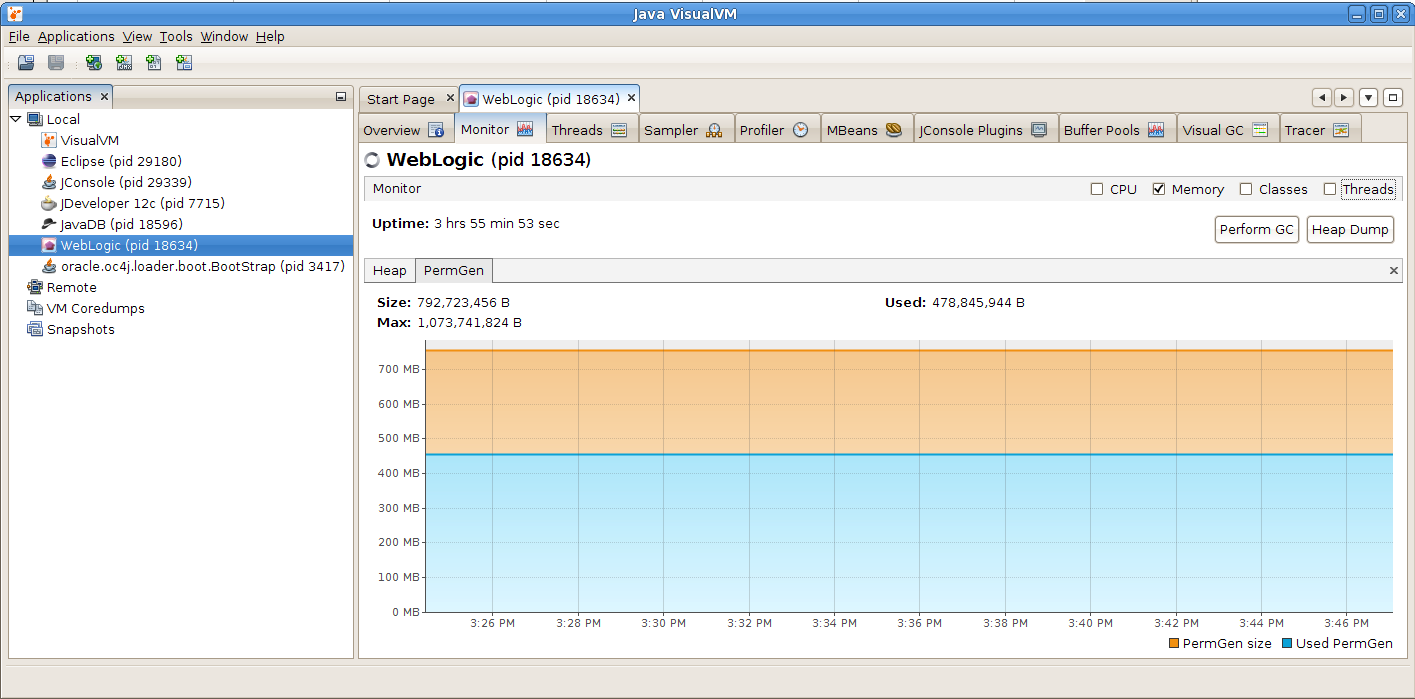
Fig. 5. Monitoring Permanent generation space
We can observe from the Figure 5. that, once the objects have been loaded into Permanent generation space, the memory occupancy remains constant. When we observe that behavior under the load test we can see when the memory occupancy is going to stabilize itself. In example on Figure 5. that is around 450 MB. Adding 10-15% safety margin to that value will give us right estimate for Permanent generation size.
Choosing the right garbage collector
Although the memory management is the important factor when setting up our Middleware environment, this factor is not enough in itself. Very important factor in achieving good performance is to choose right garbage collector algorithm. May be we think that we can relay on Java ergonomics feature to automatically assign right garbage collection algorithm. If this is Java 7 or 8 than it must be G1 collector. Isn’t it? Let us see the output from the default command line option produced by Java ergonomics feature:
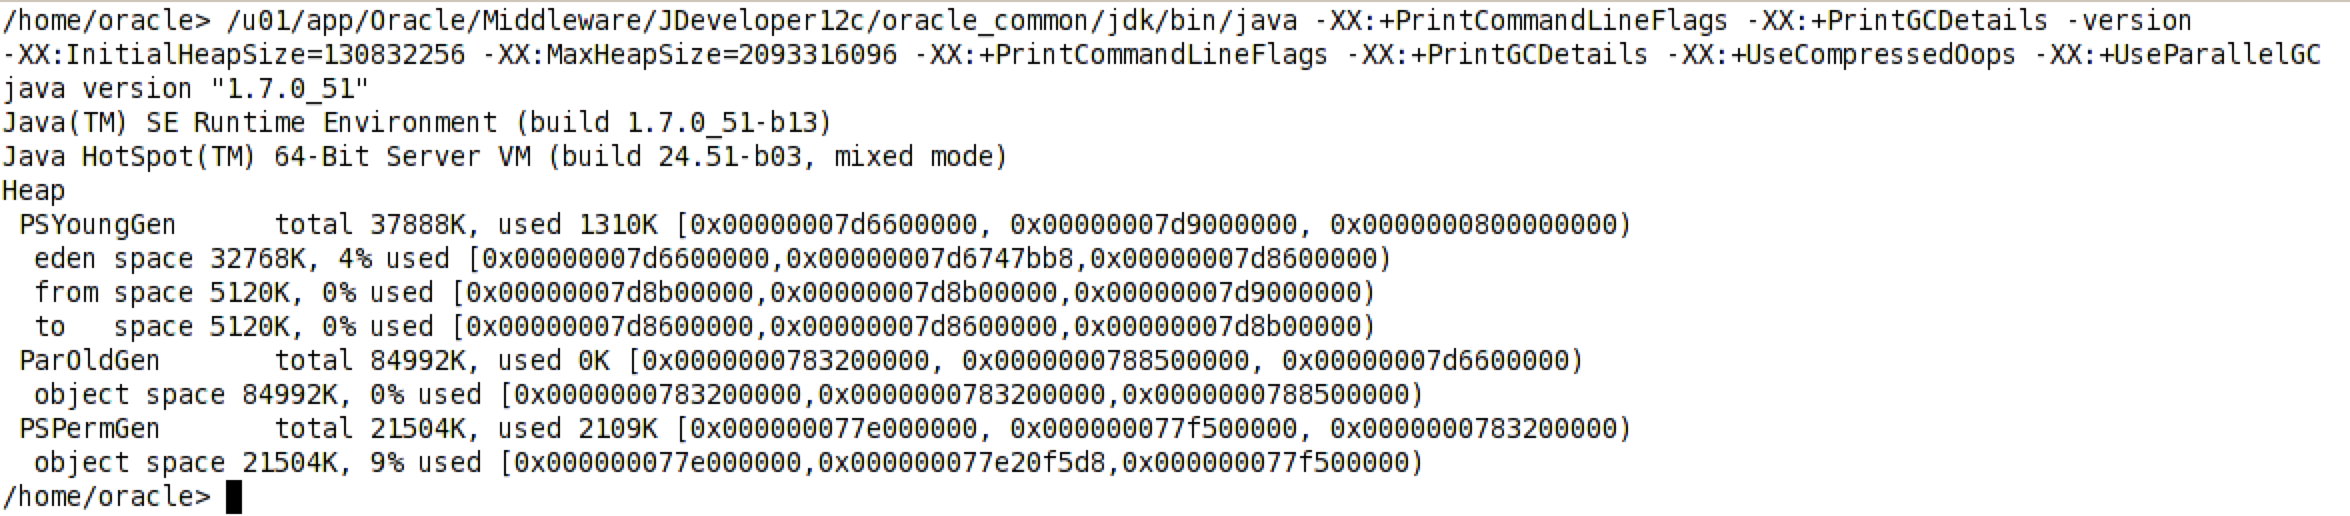
Fig. 6. Java ergonomics command line parameters
Java ergonomics will on every machine that has more than 2 cores and more than 2 GB of ram turn on the parallel garbage collector for Young generation space (-XX:+UseParallelGC). But what with Old generation and Permanent generation? For them still serial stop the world collector will run. That means when the total memory is occupied and full GC runs it will run single threaded stopping all other threads in the same time. This cleanup will be very slow. Java has this setup as the Java is not used just to run server side processes but also desktop applications that had to run concurrently with other processes not stilling all the resources for her self. Unfortunately WebLogic startup scripts are not overriding this behavior as can be observed from the operating system console during the WebLogic startup process.
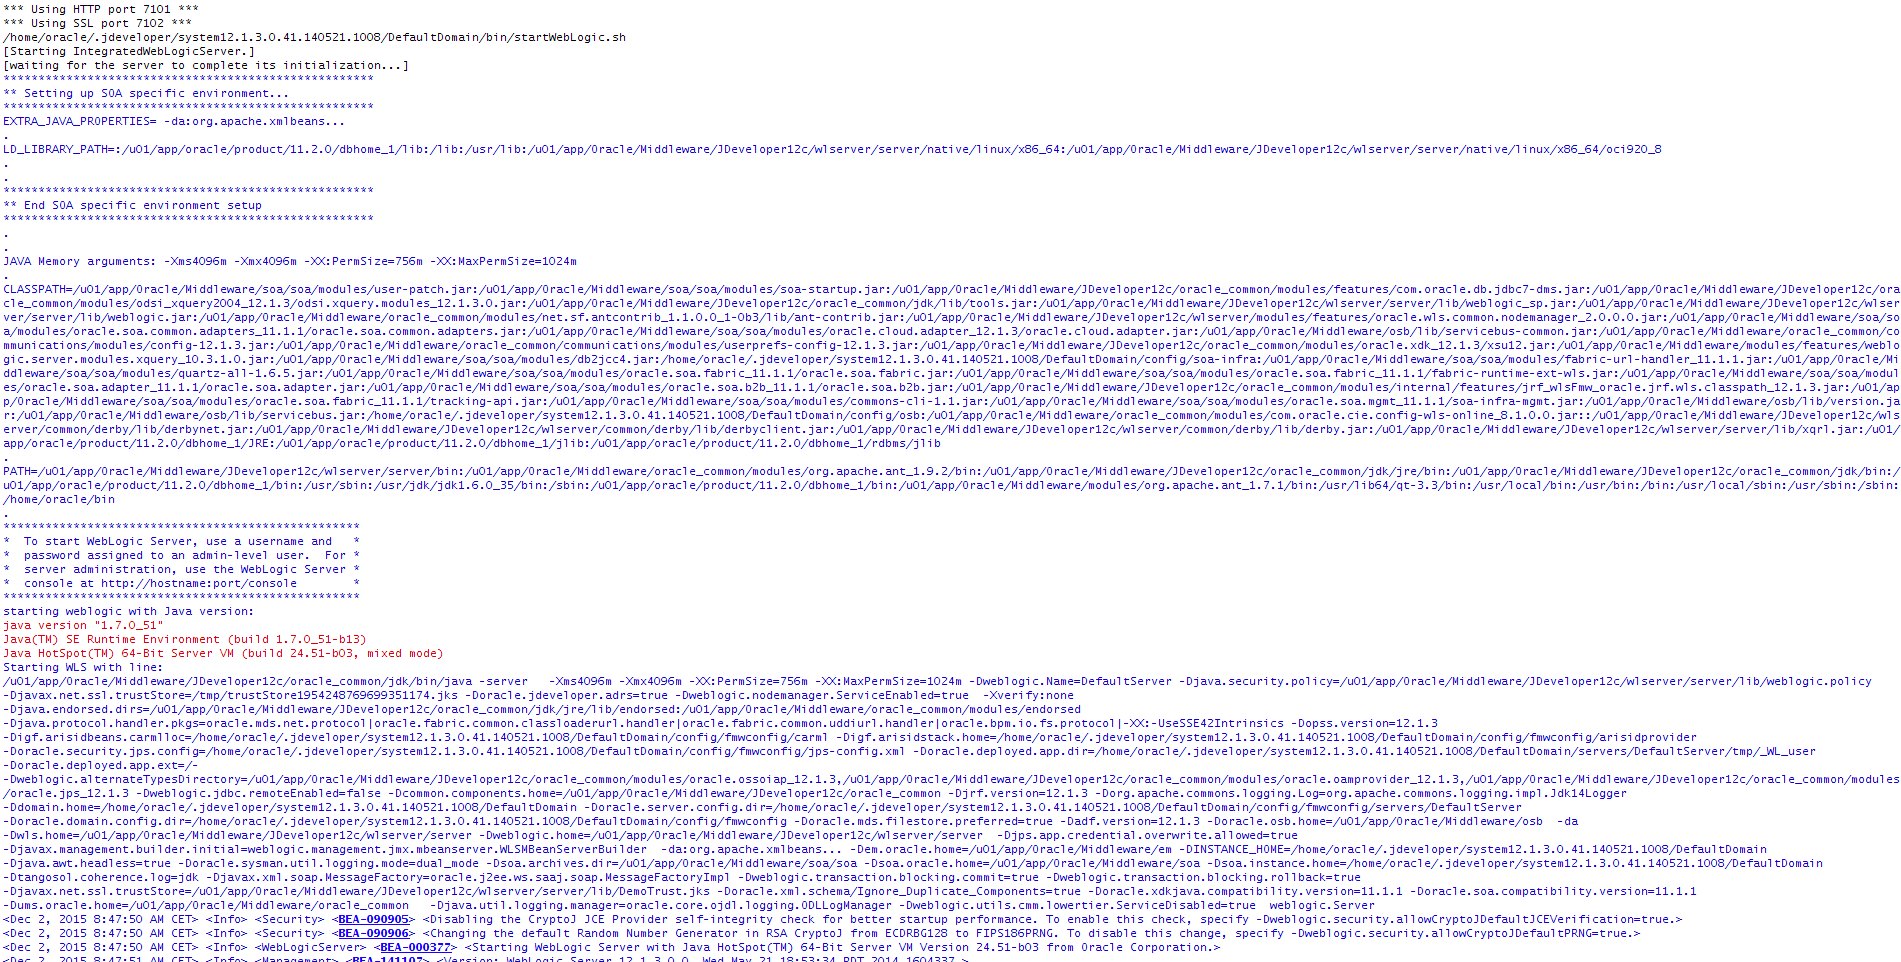
Fig. 7. WebLogic startup parameters
WebLogic startup process also relies on Java ergonomics. To optimize full GC cleanup process we are then left with tree options:
- Parallel Compacting collector
- Concurrent Mark Sweep (CMS) collector
- Garbage first (G1) collector
- Let us not rush with the conclusion assuming that G1 collector will be the best one because it is latest addition to Java technology stack. As we examine strengths and weaknesses of each of them we will see that for different situations each of them can be applied as best solution.
Parallel Compacting Collector
This type of collector run his job in parallel and is enabled by using: -XX:+UseParallelOldGC option. Number of parallel threads by default equals to the number of cores in the machine where Java is running. However this parameter is tunable and we can play with it and observe results printed out in output log to achieve best results. When it runs, Parallel Compacting Collector will stop all other Java threads and will run in stop the world mode doing his cleanup task. After the cleanup all the remaining objects in Old generation space are consolidated et the beginning of that space, allowing faster allocation of memory for new objects to come. Overlay speaking the garbage collecting algorithm is simpler comparing to two other collectors that we are going to present here. This type of collector is best in clustered environment when the throughput matters. When one JVM is not available because of the cleanup process load balancer can always redirect the traffic to the other node if the cleanup cycle is to long. However if we have sized the memory properly, because of the parallelisms involved, the cleanup cycle should be reasonably small.
Concurrent Mark Sweep Collector (CMS)
This collector does his task in parallel while the memory is being loaded in the same time. It is turned on by using: -XX:+UseConcMarkSweepGC. It is worth mentioning that although the CMS collector runs in parallel with the other Java threads, still, like in the case of Serial Compacting Collector or Parallel Compacting Collector, the young generation cleanup is always parallel stop the world session. The CMS is using one hardware tread by default. However in the machine with a lot of cores this might prove inefficient so this parameter is also tunable with: -XX:ParallelCMSThreads=
Garbage First Collector (G1)
To overcome shortcomings of CMS collector the new G1 collector has been introduced with Java 7. G1 collector, like CMS also runs in parallel but it uses completely different, more complex cleanup algorithm [5]. It is turned on by using: -XX:+UseG1GC. G1 collector has been designed to overcome difference between throughput and responsiveness. Overly it is similar to CMS collector in that it has both concurrent and parallel phases but the way how the G1 collector treats memory is completely different. Because of that it requires that wi do not size Young Generation space manually. G1 collector treats heap memory as a single continuous space that is split into fixed size regions. Size of regions is determined on JVM startup. G1 optimization algorithm can vary number of regions allocated to Young generation or to the Old space. Bare in mind that Young generation cleanup is still stop the world session so all the consideration, stressed previously in this article, still applies to G1 collector as well. As can be seen on figure 8. regions are mapped to logical representations of eden, survivor, and old generation spaces. Although internally PC memory is vector however G1 collector treats it logically as an array moving and joining regions on as needed basis.
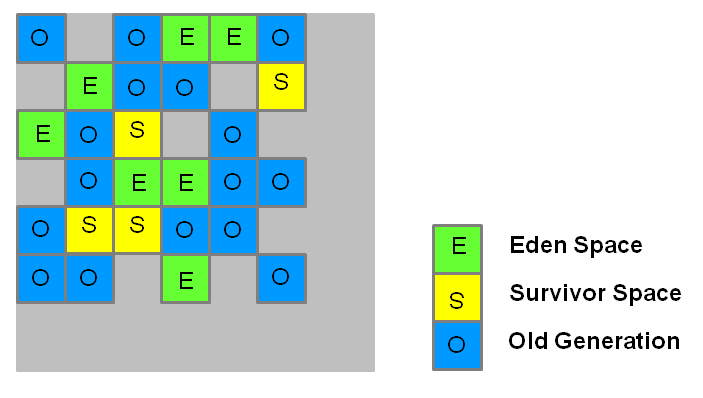
Fig. 8. G1 Heap Allocation
Live objects are evacuated to one or more survivor regions. If the aging threshold is met, some of the objects are promoted to old generation regions.
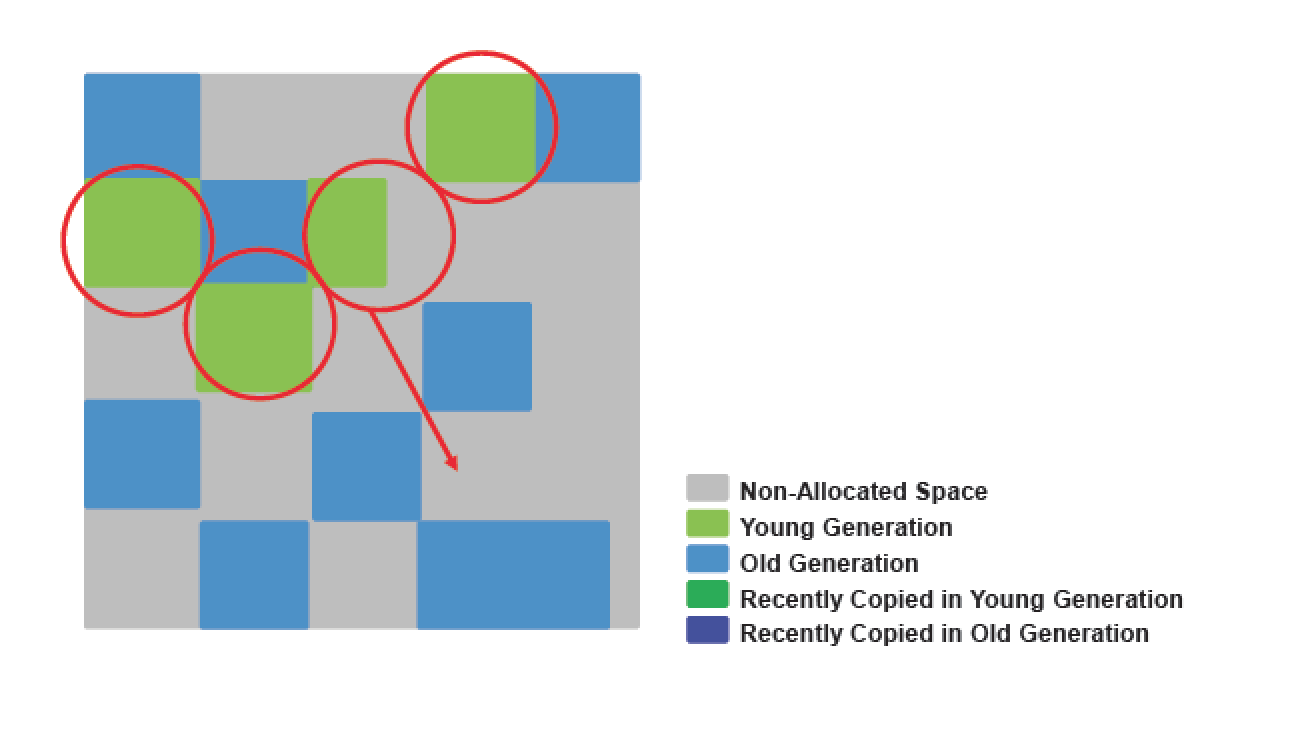
Fig. 9. Regions reallocation
With G1 collector we can still have “Lose the race” occurrence or more properly “Evacuation failure”, so the G1 collector also have to be tuned properly. This means setting overall heap size correctly as explained before adding enough threshold margin in heap as like CMS collector G1 needs little bit more memory for proper functioning. This can be achieved with -XX:G1ReservePercent=n (default is 10) JVM command line option. If we have enough CPU cores in our machine we can play with -XX:ConcGCThreads=n option which will allow us to tune number of hardware threads assigned to G1 collector. One other optimization hint that we can give to G1 collector is maximum pause time that we want collector not to pass. This can be achieved with XX:MaxGCPauseMillis=
G1 is considered to be server side collector and therefore it is not turned on by default. Even WebLogic startup script do not use it by default so we have to update them in order to turn on this garbage collector. Where to find them and where to put JVM command line startup option will be addressed in the last section of that article.
WebLogic startup scripts
During the booting process WebLogic server is calling various startup scripts in chain and many of them are overriding or adding additional JVM startup options to previously set. Therefore to understand the order of scripts called is essential. When we start Admin server trough command line or by using Nodemanager the startWebLogic.sh/cmd script is invoked which resides in our domain/bin directory. This script in turn calls setDomanEnv.sh/cmd script and overrides JVM startup parameters set in:
Oracle Middleware Home/oracle_common/common/bin/commEnv.sh/cmd
In setDomainEnv.sh scrit we can add JVM command line options to this section:
EXTRA_JAVA_PROPERTIES="${EXTRA_JAVA_PROPERTIES} -Dsoa.archives.dir=${SOA_ORACLE_HOME}/soa -Dsoa.oracle.home=${SOA_ORACLE_HOME} -Dsoa.instance.home=${DOMAIN_HOME} -Dtangosol.coherence.log=jdk -Djavax.xml.soap.MessageFactory=oracle.j2ee.ws.saaj.soap.MessageFactoryImpl -Dweblogic.transaction.blocking.commit=true -Dweblogic.transaction.blocking.rollback=true -Djavax.net.ssl.trustStore=${WL_HOME}/server/lib/DemoTrust.jks -Doracle.xml.schema/Ignore_Duplicate_Components=true -Doracle.xdkjava.compatibility.version=11.1.1 -Doracle.soa.compatibility.version=11.1.1 -Ddisable-implicit-bean-discovery=true"
export EXTRA_JAVA_PROPERTIES
If you have SOA installation than setDomanEnv.sh/cmd script will call the setSOADomainEnv.sh/cmd from the same folder and this latest script will again override JVM startup parameters. In setSOADomainEnv.sh JVM options are specified for each platform so for example for Linux platform this is section that allow you to add additional JVM command line parameters:
#-----------------------------------------------------
# Linux32 and Linux64
#-----------------------------------------------------
LINUX|Linux)
  arch=`uname -m`
  if [ "${arch}" = "s390x" ]; then
     POST_CLASSPATH=${POST_CLASSPATH}:${SOA_ORACLE_HOME}/soa/modules/soa-ibm-addon.jar
     EXTRA_JAVA_PROPERTIES="${EXTRA_JAVA_PROPERTIES} -Djavax.xml.datatype.DatatypeFactory=org.apache.xerces.jaxp.datatype.DatatypeFactoryImpl -Djava.endorsed.dirs=${SOA_ORACLE_HOME}/bam/modules/org.apache.xalan_2.7.1"
     export EXTRA_JAVA_PROPERTIES

  fi
  ;;
If starting your managed server trough Nodemanager the best and most safest way is to add JVM command line option to Arguments section of server Configuration->Server Start tab in WebLogic server console, as sen from the figure 10.
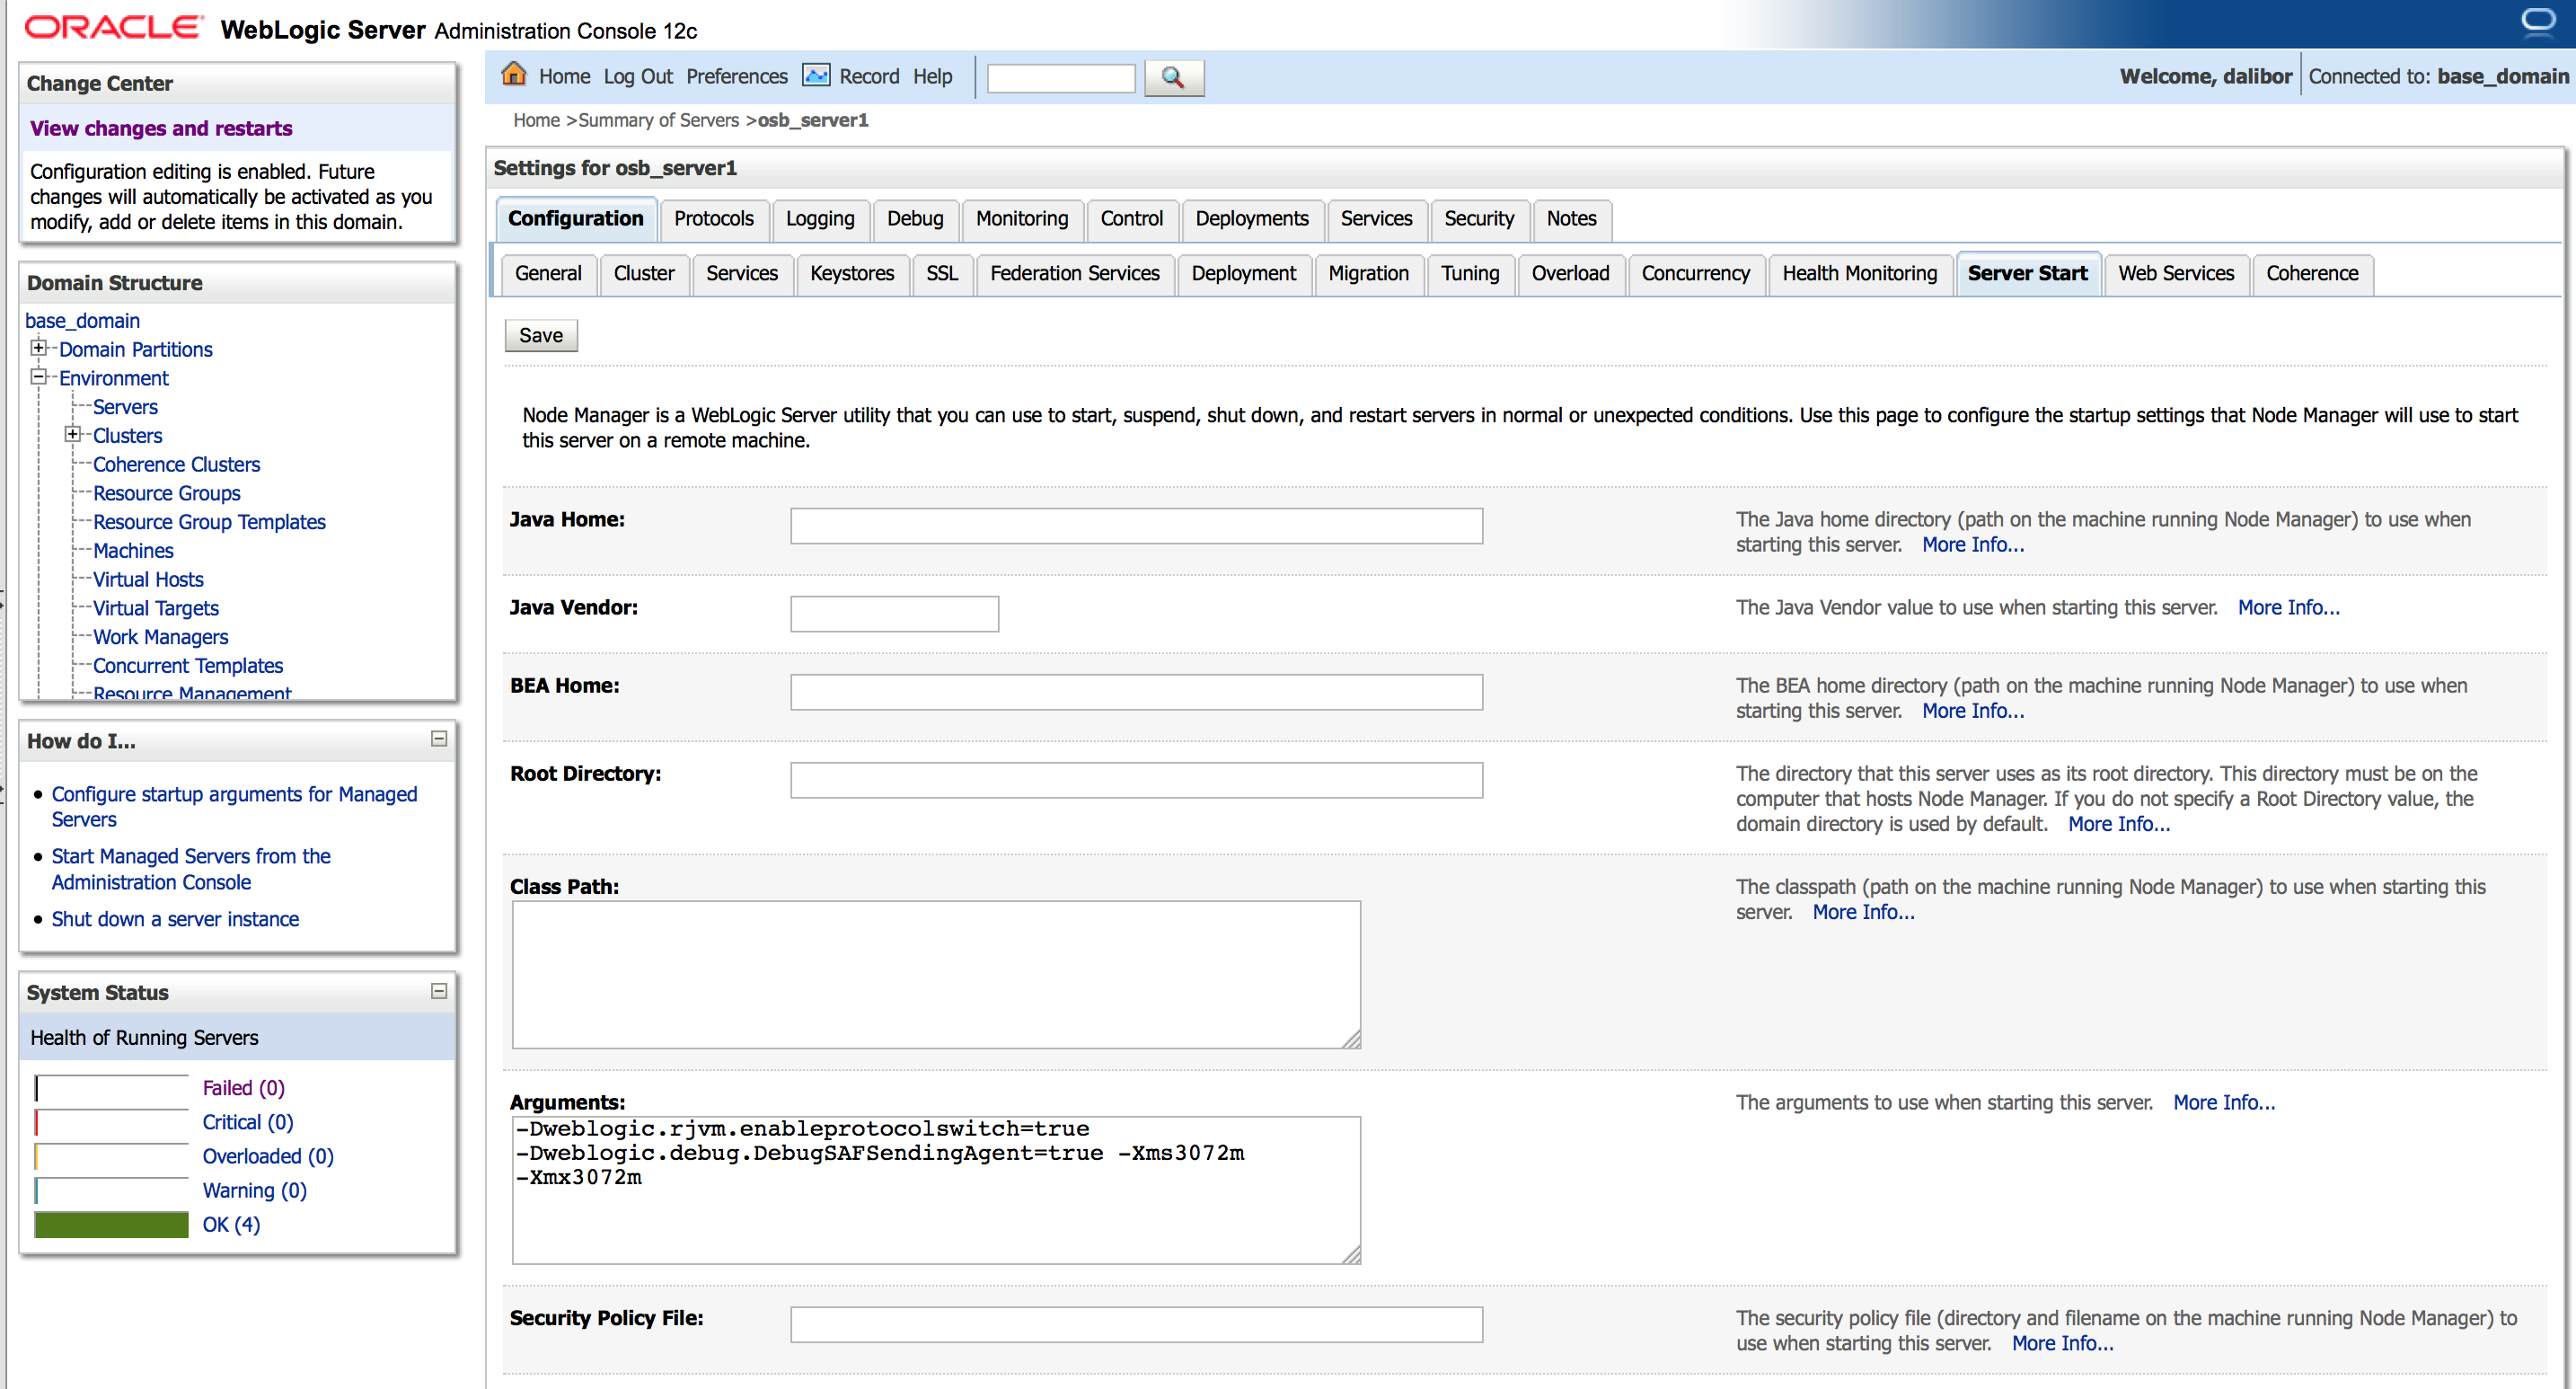
Fig. 10. Server startup arguments set in WebLogic console
Conclusion
Many people are assuming that default installation of Middleware environment provides best or at least more optimal options for WebLogic server startup parameters. However as shown by this article this is not a case and proper tuneup of JVM parameters has to be done when Middleware setup is deployed to test or production environment.
References
[1] OpenJDK (2014) JEP 122: Remove the Permanent Generation [Online document] Available from: http://openjdk.java.net/jeps/122 (Accessed: 25 April 2016)
[2] Sun Microsystems (2006) Memory Management in the Java HotSpot™ Virtual Machine [Online document] Available from: http://www.oracle.com/technetwork/java/javase/memorymanagement-whitepaper-150215.pdf (Accessed: 25 April 2016)
[3] Pierre - Hugues Charbonneau (2013) Java 8: From PermGen to Metaspace [Online document] Available from: https://dzone.com/articles/java-8-permgen-metaspace (Accessed: 25 April 2016)
[4] Oracle (2016) Java Platform, Standard Edition HotSpot Virtual Machine Garbage Collection Tuning Guide, 4 Sizing the Generations [Online document] Available from: https://docs.oracle.com/javase/8/docs/technotes/guides/vm/gctuning/sizing.html (Accessed: 25 April 2016)
[5] Oracle (2016) Getting Started with the G1 Garbage Collector [Online document] Available from: http://www.oracle.com/webfolder/technetwork/tutorials/obe/java/G1GettingStarted/index.html (Accessed: 25 April 2016)